
OBJECTIVE
This example is relevant to a Consultation
‘VAT Treatment of Fund Management’
(PUBLIC CONSULTATION RESPONSES DECEMBER 2022).
The project was within 3 months timeframe and required rapid examination and distillation of complex financial domains.
OUTCOME
The research and visualisations provided our Treasury stakeholders with a richer picture of the eco-systems, environments and experiences of VAT in Fund Management, enabling considerate and
wide-reaching policy initiatives and qualifying much of the Consultation responses into significant context.
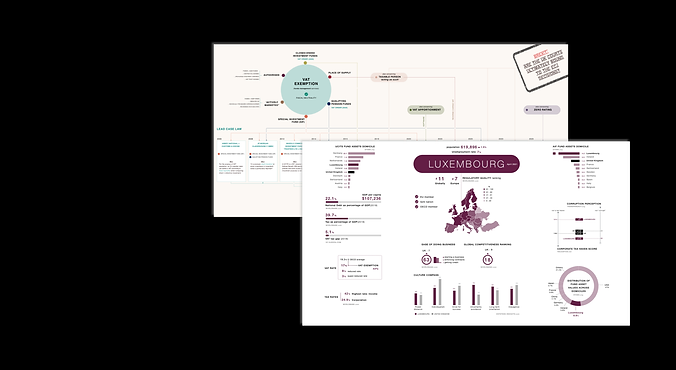
METHOD
Fund management is a wide ranging and specialist domain. I researched the structures, governance and taxonomies of funds, across the UK and globally. I mapped these to the VAT tax treatment in the UK and across the EU, and for other taxation liabilities.
As part of a series of design tasks, I looked to the international landscape and visualised comparisons with the UK across several publicly available metrics.
I researched relevant case law and mapped a sequence of connected, relevant cases and their impacts on existing policy and law.